An interval that closes below the bottom band, followed by another that closes within, may signal a reversal and a good time to buy.
If prices are in a downtrend and back in the bands, this is interpreted as a signal the existing down trend will not continue and that the market will move sideways and then probably back up.
Bollinger Bands form an area of Support and Resistance. Use them to take profits. If prices break above or below the Bands, it results in a changed Support and Resistance.
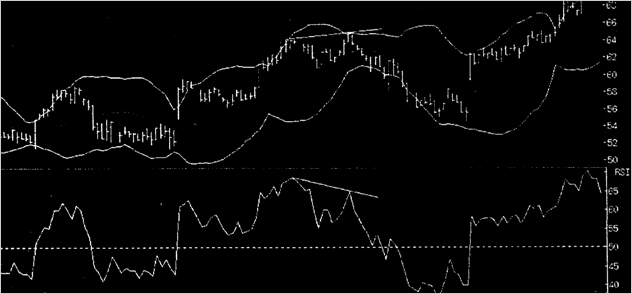
Trend reversals can be confirmed when used with an Oscillator, such as the Relative Strenght Index (RSI). Signals such as:
Price being close to the lower band with the RSI confirming a trend reversal should be a safe buy signal.
Price divergence with an RSI can confirm the bottom or top of a band (see Fig. 1).
A final point — like any other technical analysis technique, the trader must incorporate their own personality and comfort levels to the trading rules of Bollinger Bands. Good luck!
Exercises
Ex. 1. Put questions to the underlined words.
Ex. 2. Analyse noun collocations.
Ex. 3. Translate the article.
