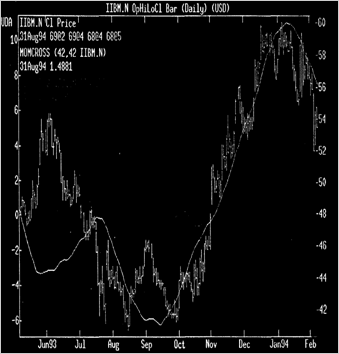
The formula parameters are as follows and need to be filled in at the time of charting: vl —timeseries (instrument), nl — observation period for momentum (lag period), n2 — averaging period for moving average. The diagram shows a short and long momentum crossover analysis giving clear buy and sell signals. The momentum crossover analysis is simply a smoothed version of the standard momentum analysis. Two of these analysis on the same chart, one with a long, the other with a short averaging period can be used in the same way as two standard simple movine averages, (i.e. crossover indicates buy and sell signals) except that the lines will oscillate around zero. Uptrends are indicated bv price action below the momentum crossover lines. The momentum crossover line cutting through price after a trend has been established (up or down) indicates trend reversal. The analysis should not be used in a sudeways market as it tends to be choppy in the same manner as ordinary moving averages. To create the Momentum crossover analysis, simply add the following formula into the UDA editor of either RTA or RTAu. Then graph the momentum crossover twice with differing length averaging and observation periods overlaid with a price chart. The momentum and moving average oeriod parameters
should be the same as those used for short and long moving average crossovers for the instrument you are trading.
Exercises
Ex. 1. Put questions to the underlined words. Ex. 2. Find verbals and state their syntactical function in th Ex. 3. Analyse noun collocations.
e momentum — скорость изменения цены
moving average — скользящая средняя lag - отставание во времени
и: 'smoothed - сглаженный
о to'oscillate - колебаться
ou ei to overlay — наложить
e sentence.
