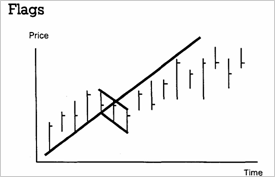
A common consolidation pattern that occurs on price charts is the rectangle. This technical formation usually occurs at the end of a strong market move, either an uptrend or downtrend, and typically represents a pause in the action. A rectangle is also known as a trading range or a consolidation and is easy to observe because price movements are clearly confined by two parallel lines. A rectangle normally is resolved as a continuation pattern, see Flags. This means that prices should continue in the direction they were moving before the consolidation began. Another clue to the direction of the breakout is the volume pattern within the rectangle. If volume is stronger during the rallies than on the declines, the upside breakout is more probable. The measuring objective after a breakout is determined by the height of the trading range. This distance is added to the level of the breakout point to reach a minimum objective. Similar to a triangle pattern, strong volume is necessary on an upside move to validate the breakout. It is not necessary for a downside breakout.

One of the most reliable of all technical formations is the
flag or pennant pattern. These patterns are very similar. Both are formed after a sharp, straight-line move that occurs on heavy volume (either up or down). After the move. a flag is formed by a short, choppv consolidation period. This consolidation is bounded by two parallel lines (rectangle). A pennant is formed after a strong move during a short consolidation period that resembles a small triangle or wedge. Flags and pennats are almost always continuation patterns, and are confirmed when volume
declines during the consolidation, then prices break the respective consolidation trendlines on strong volume (i.e., the upper boundary line after an up move, and the lower boundary line after a down move). After the breakout, prices should continue moving by an amount equal to the move that preceded the brief consolidation. In this respect, flags and pennants are said to "fly at half mast". The beginning of the move is usually the point where prices broke out of another chart pattern, or breached important trendline support or resistance.
Pennants
A pennant is a fairly common formation, sharing most of
its characteristics with flags. Both are formed in dynamic markets. with a "flagpole" formed by an impulsive almost straight line move. A brief period of consolidation results to form the pennants "mast", which is shaped like a small symmetrical triangle. Thereafter, prices move in the direction of the initial impulsive move and for a similar distance, i.e. the mast evolves halfway through the move. Thus to measure the distance of the total move, the length of the flagpole up to the mast is measured and projected from the breakout point of the pennant.
ý
'choppy — ÷àñòî ìåíÿþùèéñÿ
i:
precede — ïðåäøåñòâîâàòü
to fly at half
mast — ïðèñïóùåííûé ôëàã
ý
evolve — ðàçâåðòûâàòüñÿ ,
ýâîëþöèîíèðîâàòü
å
project — ïðîåêòèðîâàòü
