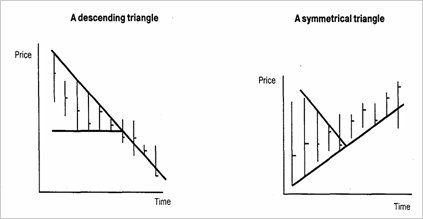
The ascending and descending triangles are price patterns that occur on bar charts and are similar in many respects to the more familiar symmetrical triangle. An ascending triangle is formed by a high. a low, a second high approximately equal to the first high, and a second low which is higher than the first low. For a descending triangle the situation is reversed. This pattern forecasts future price movement because prices are expected to break in the direction of the two equal price levels (to the high side on ascending triangles, and to the low side on descending triangles). In order for the pattern to be valid, two important conditions must be met:
1. Volume and open interest should decline as the triangle forms.
2. The breakout should occur between 1/2 to 3/4 of the distance from the start of the pattern to the apex.
When a breakout occurs, prices should continue in the same direction by an amount equal to the distance from the highest high in the triangle to the lowest low. The symmetrical triangle is seen when highs become lower and lower, and lows become higher and higher, with the resistance and support lines converging. This must be done in nearly a horizontal trend to avoid forming a wedge. Keep in mind that triangles are quite often continuation patterns, see Flags.

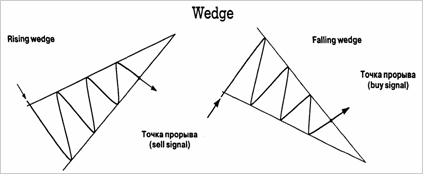
A wedge pattern on bar charts is similar in certain respects
to a symmetrical triangle formation (in fact triangles are some times referred to as wedges). However, wedees have distinct features from triangles: A rising wedge is characterized by a high, a low, a higher high and a higher low. This will give the appearance of an uptrend, but in a wedge the line connecting the highs and the line connecting the lows converge, whereas in a channel they will remain more or less parallel. In a triangle, either the highs or the lows are roughly equal, or else the convergence takes place
with no trend implications, as in a symmetrical triangle. It is rising, or falling, nature of the wedge that separates it from the triangle formation.
Wedges form most often as a counter-trend consolidation
area. This means that during a strong downtrend, a rising wedge will sometimes form as a corrective pattern before the down trend resumes. Thus, a rising wedge has bearish implications, and a falling wedge has bullish implications. After the wedge forms, a breakout is confirmed when prices break the corresponding trendline the lower one in a rising wedge and the upper line in a falling wedge. After the breakout, prices should travel at least as far as the starting point of the formation.
Rectangle
Э:
converge
— сходятся
ei
implication
— то, что подразумевается
e
rectangle
— прямоугольник
о
to resolve
— разрешаться, решаться,
формироваться
u:
clue
— указание, наметка
ae
to validate
-узаконить
